
Data Recording
CONNECT can write selected signals to an InfluxDB 2.x database and serve the recorded ranges back to realvirtual. The viewer then shows a signal not only as a current value but as a curve over time — next to the machine it belongs to.
Recording is optional and off until an InfluxDB is configured. Nothing is recorded implicitly.
What gets recorded
Section titled “What gets recorded”Recording is a per-signal decision: set the Record flag on the signals you care about. This works for the flat signal list of any interface and for the signals of an MQTT process image.
Choose deliberately. A production line has thousands of signals, and the interesting ones are usually a few dozen: cycle counters, temperatures, speeds, states.
Setting it up
Section titled “Setting it up”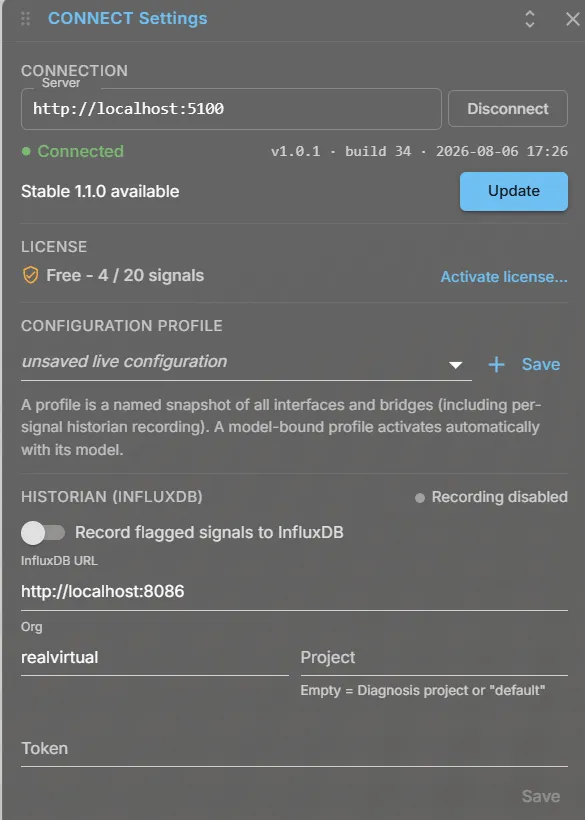
- Install or point to an InfluxDB 2.x instance. It can run on the same PC or anywhere the gateway can reach.
- Provision the buckets — the gateway’s
deploy/influxdb/scripts create them, their downsampling tasks and a project-scoped token. - Enter URL, organisation and token in the gateway’s configuration.
- Set the Record flag on the signals you want and check the Historian panel in the viewer.
The token is stored in the gateway configuration and never handed to the browser. All history requests go through the gateway, which is what keeps the database credentials out of the client.
Options
Section titled “Options”The first four options are what you set to get recording running. The rest tune how much data ends up in the database and only need attention if the defaults do not fit your machine — see How writing behaves for what they actually do.
| Option | Default | What it does |
|---|---|---|
Enabled | false | Turns recording and history queries on. Nothing is recorded while this is off. |
Url | http://localhost:8086 | Base URL of the InfluxDB 2.x instance. |
Org | realvirtual | InfluxDB organisation name. |
Token | (empty) | Project-scoped token. Never returned by the REST config API and never sent to the browser. |
Project | (empty) | Names the bucket set, so several machines can share one database. Falls back to the AI diagnosis project, then to a default. |
FloatDeadbandPercent | 0.5 | Minimum relative change of a float, in percent, before it is written. Raise it if a noisy analogue value fills the database. |
MinIntervalMs | 100 | Shortest interval between two writes of the same signal. Raise it for very fast signals. |
MaxIntervalMs | 5000 | Latest a heartbeat is written for an unchanged signal — this is what proves a value stayed constant rather than the recorder having stopped. |
BatchSize | 500 | Points per write request. |
FlushIntervalMs | 1000 | Longest a partly filled batch waits before it is sent. |
ChannelCapacity | 65536 | Size of the write queue. When it is full, the oldest points are dropped and counted rather than blocking the machine connection. Raise it only if the Historian panel reports dropped points during normal operation. |
These live under InfluxDb in the configuration file — see the configuration file reference.
Retention
Section titled “Retention”A project uses three buckets with increasing retention and decreasing resolution:
| Bucket | Resolution | Retention |
|---|---|---|
<project>_raw | as recorded | 7 days |
<project>_1m | one minute | 1 year |
<project>_1h | one hour | 10 years |
When a chart is requested, the gateway picks the bucket that fits the time range and limits the answer to roughly 5,000 points per signal — a week-long range therefore answers as fast as a one-hour range.
How writing behaves
Section titled “How writing behaves”The writer takes an initial snapshot when it starts and then applies two rules that keep the database small without losing the shape of the data:
- a deadband, so a value that only jitters is not stored;
- a minimum interval, so a fast-changing value is not stored more often than useful;
- a heartbeat at a maximum interval, so a constant value still proves it was constant.
Points are batched through a bounded queue. An InfluxDB outage never blocks a protocol interface: the machine connection keeps running, the oldest queued points are dropped and counted, and the writer reconnects on its own. The Historian panel shows the connection state and the number of dropped points, so a silent gap is visible as a number.
In the viewer
Section titled “In the viewer”The Historian panel lists which signals are currently recording and which ones exist in retained history, and it draws the ranges you select. Record flags can be changed from there without touching the configuration file.
See also
Section titled “See also”- Configuring interfaces — where signals are defined
- AI diagnosis — operator comments can be stored alongside the recorded history