
Settings
Settings are stored in the browser, not in the model. A colleague opening the same link sees their own settings. A delivery can lock individual tabs so an operator cannot change them.
Click the gear at the bottom of the left bar to open settings. In a narrow panel, use the arrows at either end of the tabs to scroll horizontally.
The viewer version and build number appear at the bottom of every tab. Include them in support requests to identify your build.
Visual
Section titled “Visual”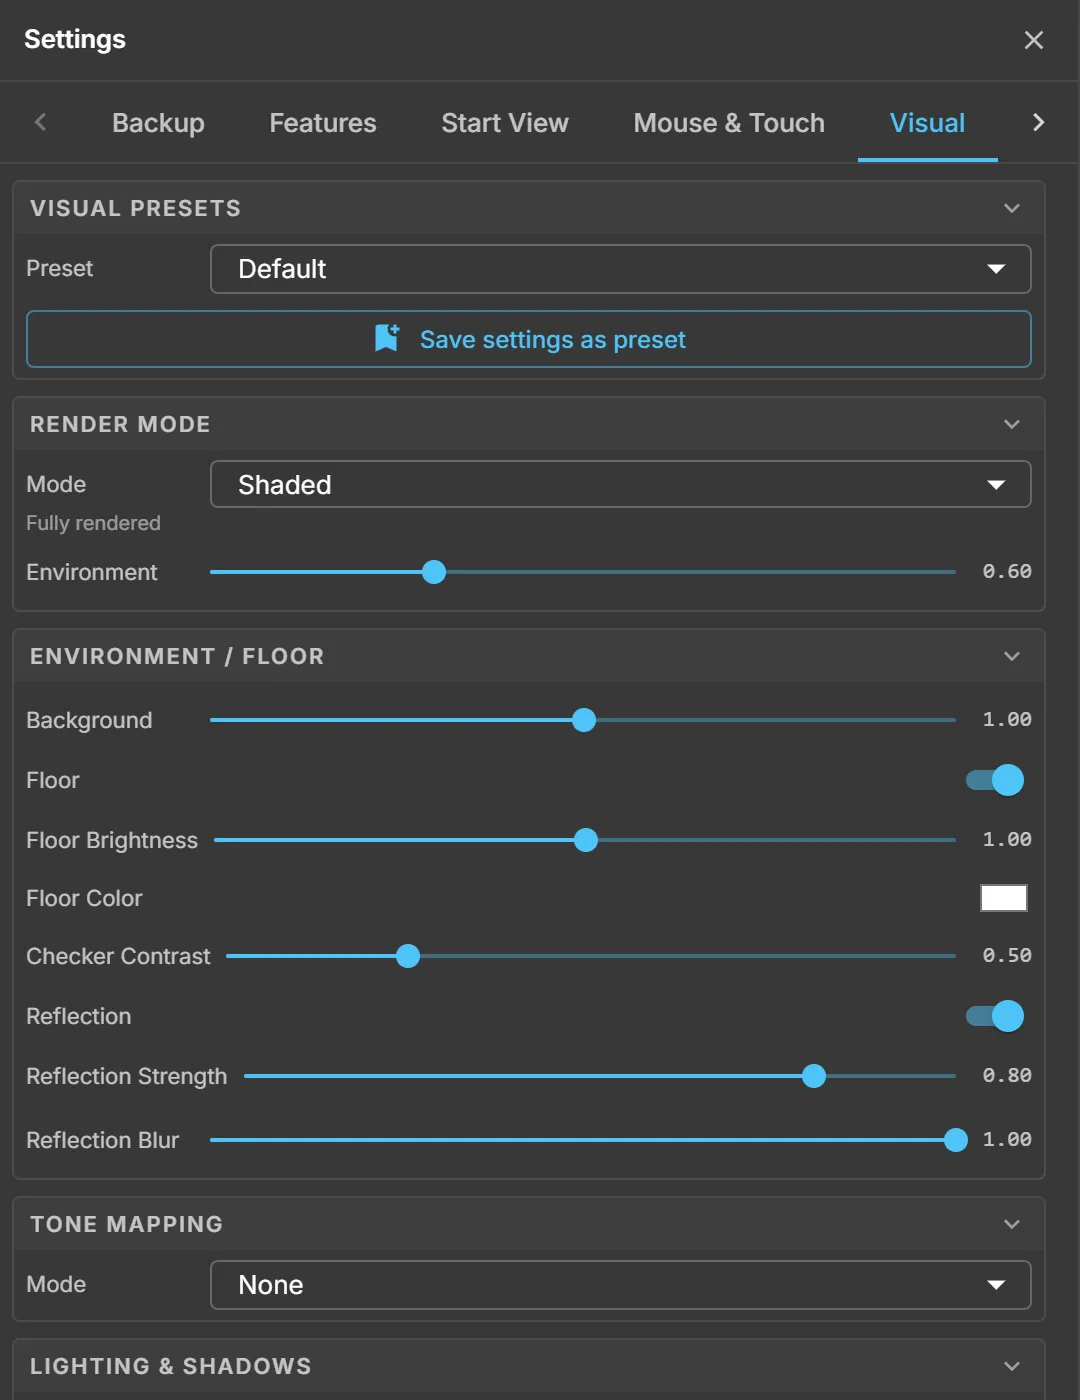
This is the largest settings tab. Use it to adjust the model’s appearance and rendering performance.
| Group | What it holds |
|---|---|
| Visual Presets | A named set of all visual settings. Save your own with Save settings as preset |
| Render Mode | How surfaces are drawn, and a base colour for the simpler modes |
| Environment / Floor | Background, floor on/off, floor brightness and colour, checker contrast, floor reflection strength and blur |
| Reflections | How strongly the environment is reflected in the model |
| Tone Mapping | The curve that maps rendered brightness to the screen, and the exposure |
| Lighting & Shadows | Directional light, intensity and colour, shadows on/off, shadow intensity, quality, shadow-map size and radius |
| Post-Processing | Ambient occlusion (darkening in corners and gaps) and bloom (glow around bright parts) |
| Toon / Edge | A drawing-like look with flat colour bands and outlined edges, for presentations |
| Display | UI zoom from 75 % to 200 %, source markers, the drive axis gizmo, Show AI eye, toolbar labels, antialiasing and render resolution |
| Renderer | The 3D backend: WebGL, or WebGPU as an experiment — see Browser & GPU setup |
| Camera | Perspective or orthographic, and the field of view |
If the frame rate is low, work down this list: shadow quality, then shadow map size, then resolution, then antialiasing, then reflections. The first steps usually gain the most speed for the least visible change. Check which graphics card the browser uses before adjusting these settings. Browser & GPU setup explains how, including why a fast workstation may render on the CPU.
On a panel PC, set UI zoom to 125 % or 150 % to read the overlay at arm’s length without changing the operating system’s scaling.
Mouse & Touch
Section titled “Mouse & Touch”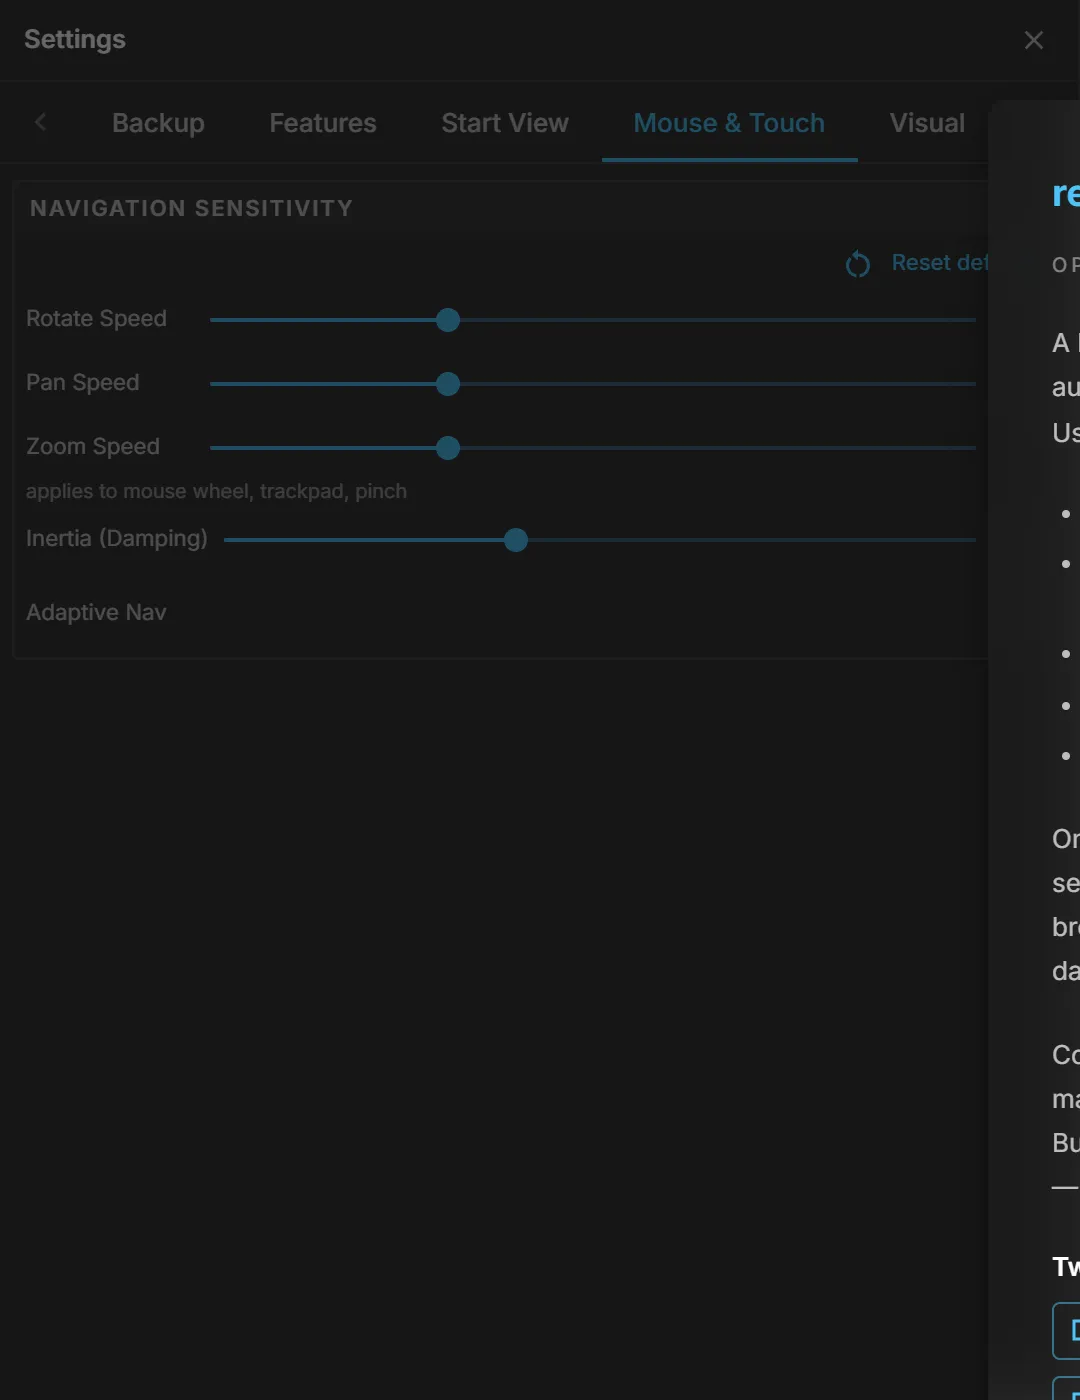
Set rotate, pan and zoom speeds, and the inertia that keeps the view moving after you release the control. Two switches change how the camera follows the mouse:
- Zoom to mouse cursor — the wheel zooms towards the point under the cursor instead of the centre of the screen.
- Orbit around point under cursor — dragging to rotate turns the view around the part under the cursor.
Zoom speed applies to the mouse wheel, the trackpad and pinch alike.
Start View
Section titled “Start View”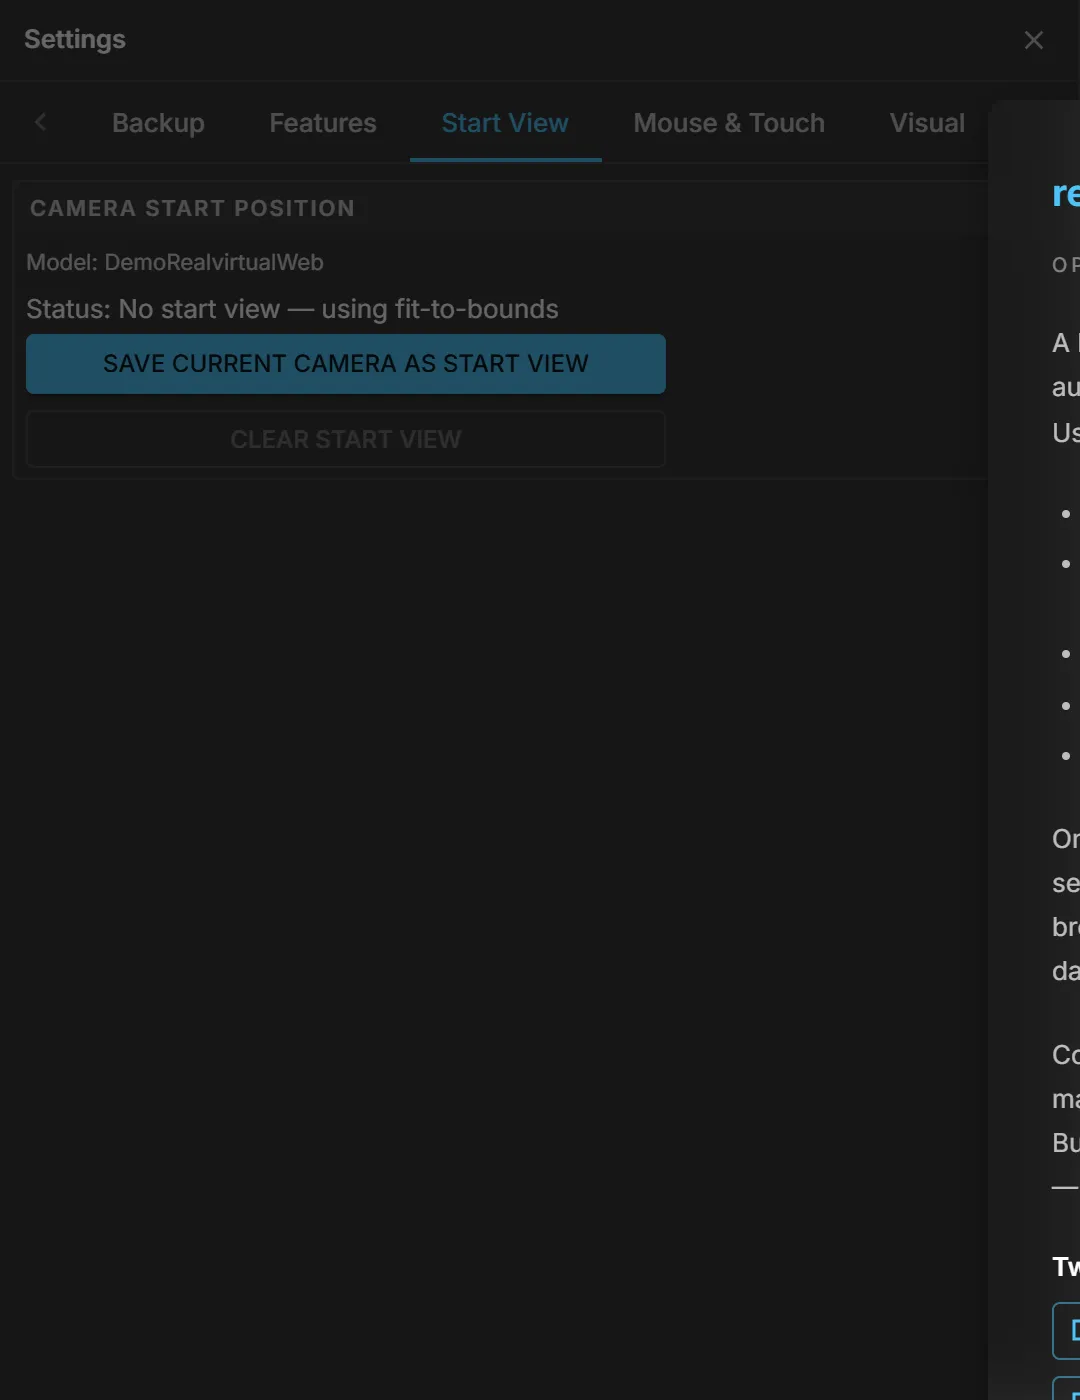
Sets the camera position when a model opens. Without a saved position, the viewer fits the model into the view.
Frame the view, then click Save current camera as start view. The viewer stores a separate start view for each model. Click Clear start view to fit the model into the view again.
Simulation
Section titled “Simulation”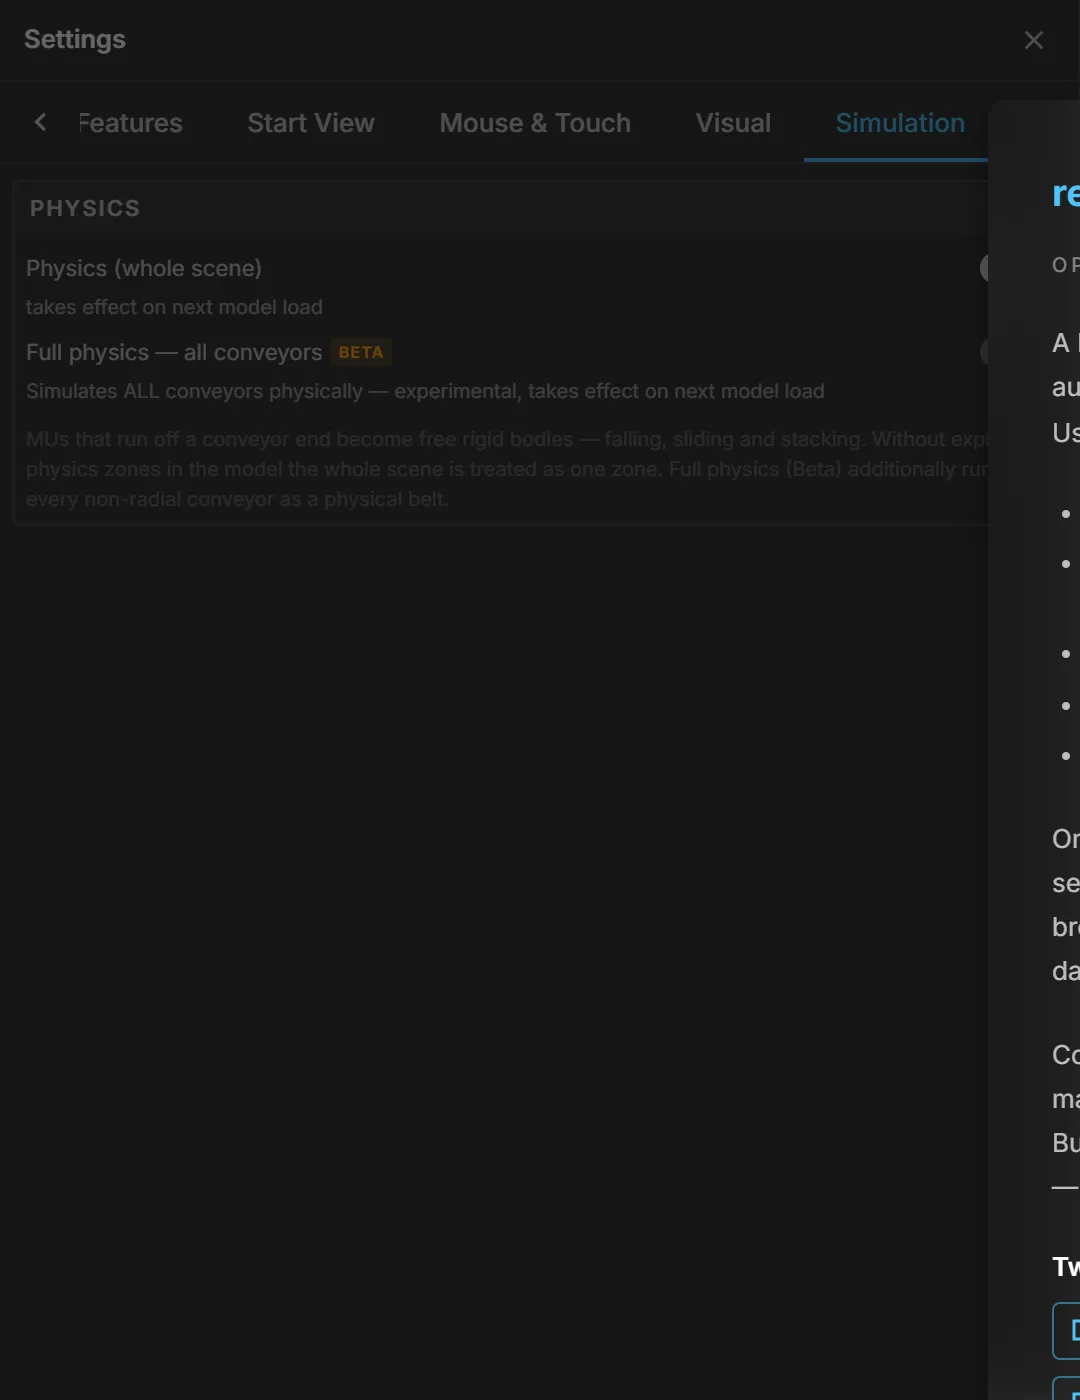
Controls the local simulation. It does not control the connection to a machine.
Physics (whole scene) decides whether moving parts become physical bodies when they leave a conveyor — falling, sliding and stacking instead of disappearing. Without explicit physics zones in the model, the whole scene counts as one zone.
Full physics — all conveyors is a beta feature that makes every non-radial conveyor run as a physical belt. Both settings take effect on the next model load, as indicated on the switches.
Groups
Section titled “Groups”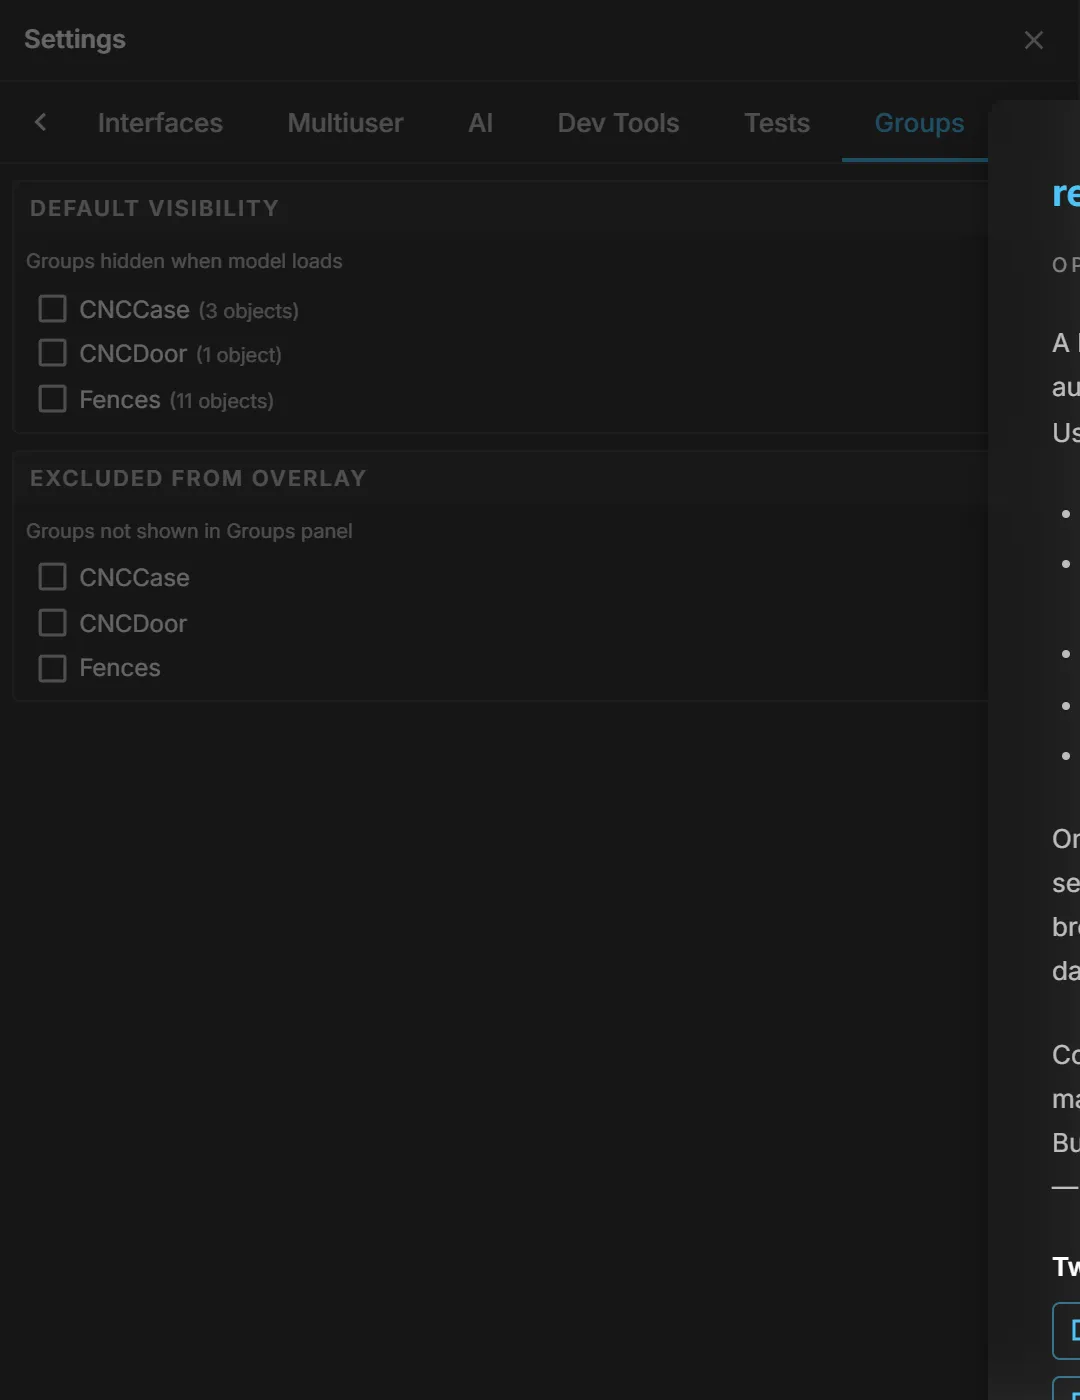
Models include visibility groups, such as fences, housings and covers. This tab controls:
- Default visibility — which groups are hidden when the model loads. Hiding the fence by default is the usual first move on a cell.
- Excluded from overlay — which groups do not appear in the Groups panel at all. Use it to shorten the operator’s list. It does not hide the groups themselves.
Interfaces
Section titled “Interfaces”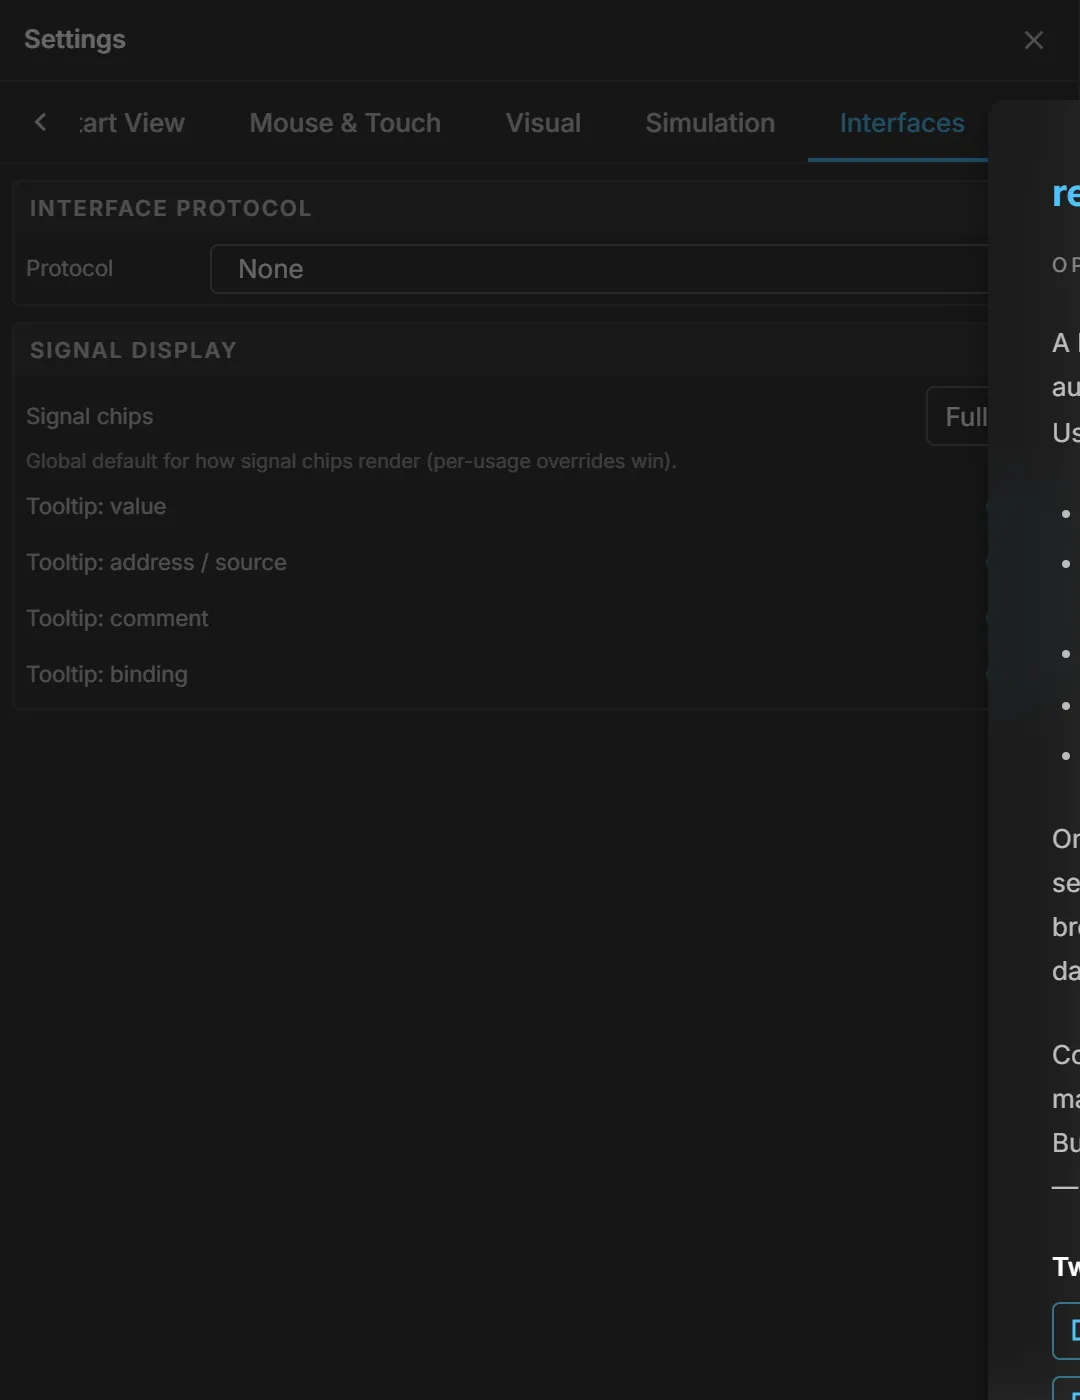
Interface Protocol selects how the viewer talks to a controller directly, without realvirtual CONNECT in between: WebSocket Realtime, ctrlX (Bosch Rexroth), TwinCAT HMI (Beckhoff) or MQTT. None is the default — the usual setup goes through CONNECT.
- Connection — address, port and path of the controller, Use SSL (wss://) for an encrypted connection, and an auth token where the controller asks for one.
- MQTT Broker — broker URL, user name, password and topic prefix, when MQTT is selected.
- Connection Control — Auto-Connect connects as soon as a model loads; Status shows the connection state and the number of signals.
Signal display controls how much a signal chip shows, from the full name and value to a compact form. It also selects the tooltip details: value, address and source, comment, binding. This global default can be overridden for individual uses in the model.
Multiuser
Section titled “Multiuser”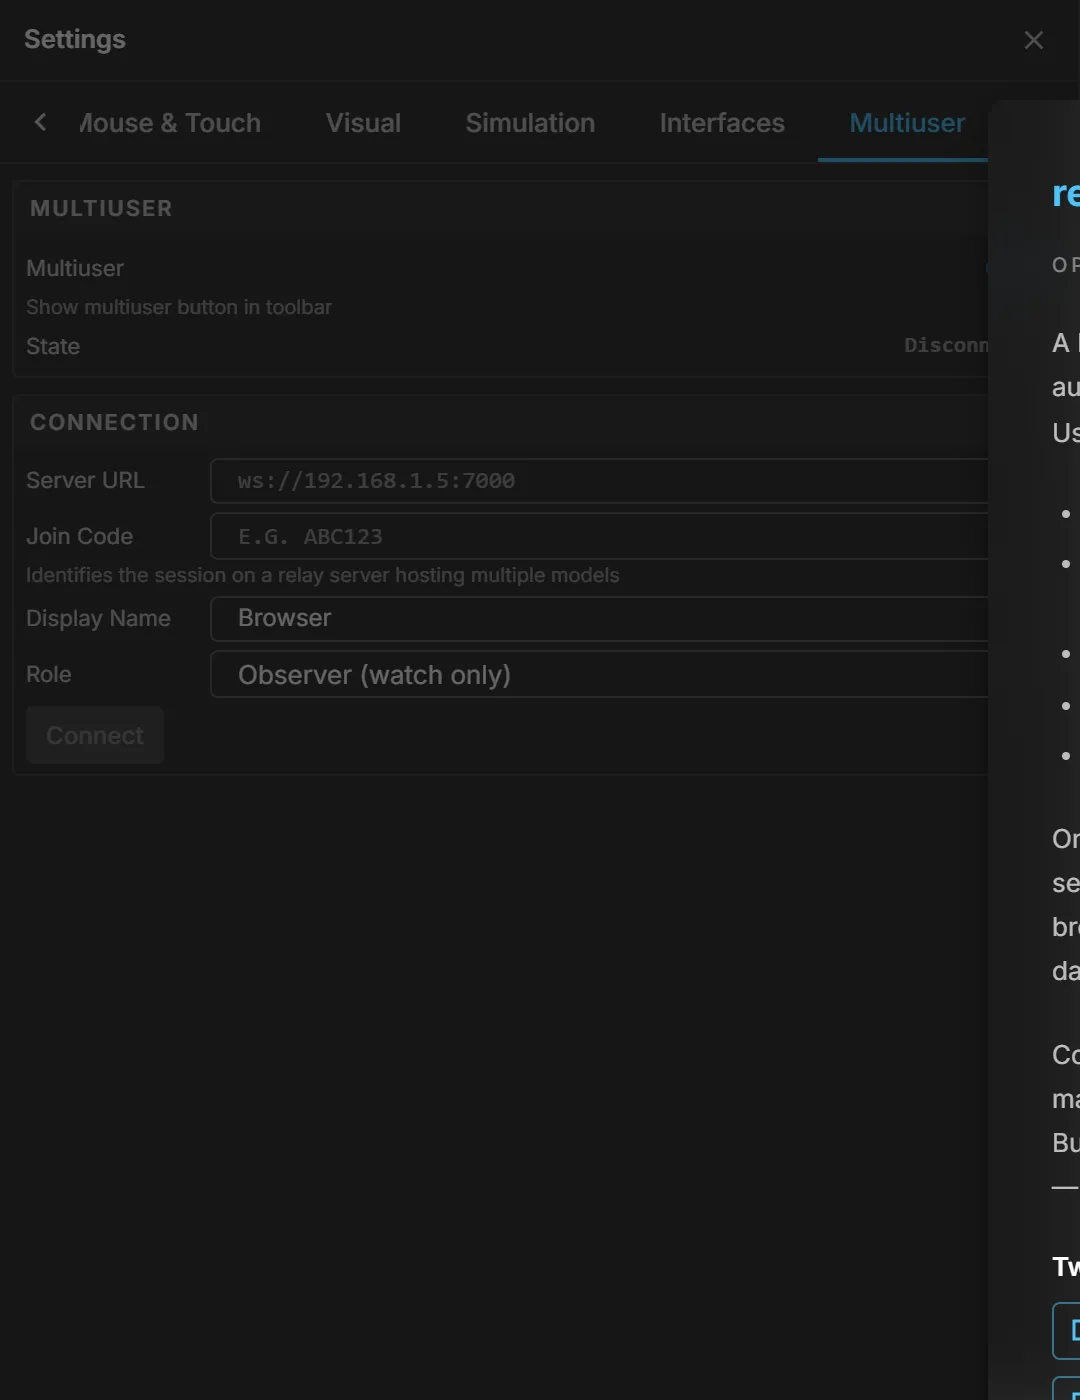
If your delivery supports shared sessions, set the server URL, join code, display name and role here. Observer can only watch. Operator has full control.
The state line shows whether you are connected. Use the switch to hide the multiuser button from the toolbar.
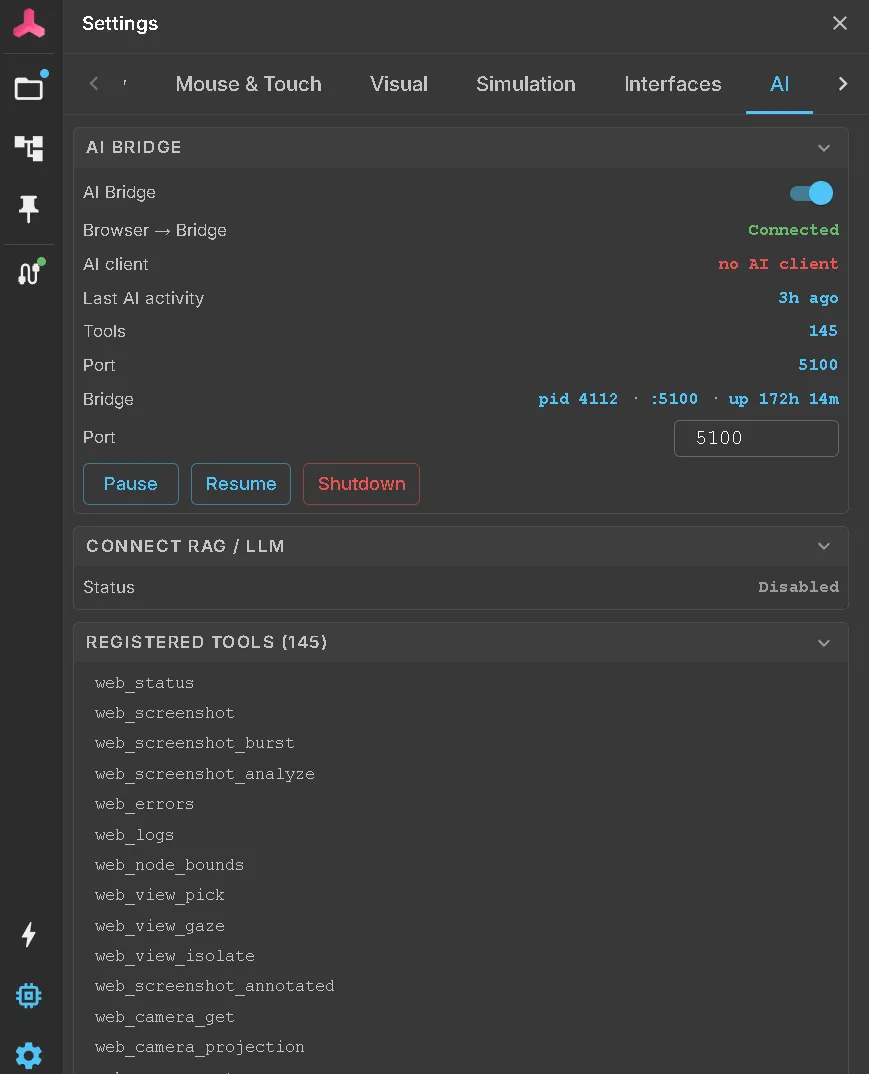
This tab contains the AI bridge and the documentation index for AI diagnosis. When the bridge is on, it shows the connection state, port and every available tool by name. The tab opens only after you have seen what the bridge can access on this device.
The tab shows the same status and controls as the panel described under AI assistant (bridge), which also covers connecting an assistant and what it may then do.
Dev Tools
Section titled “Dev Tools”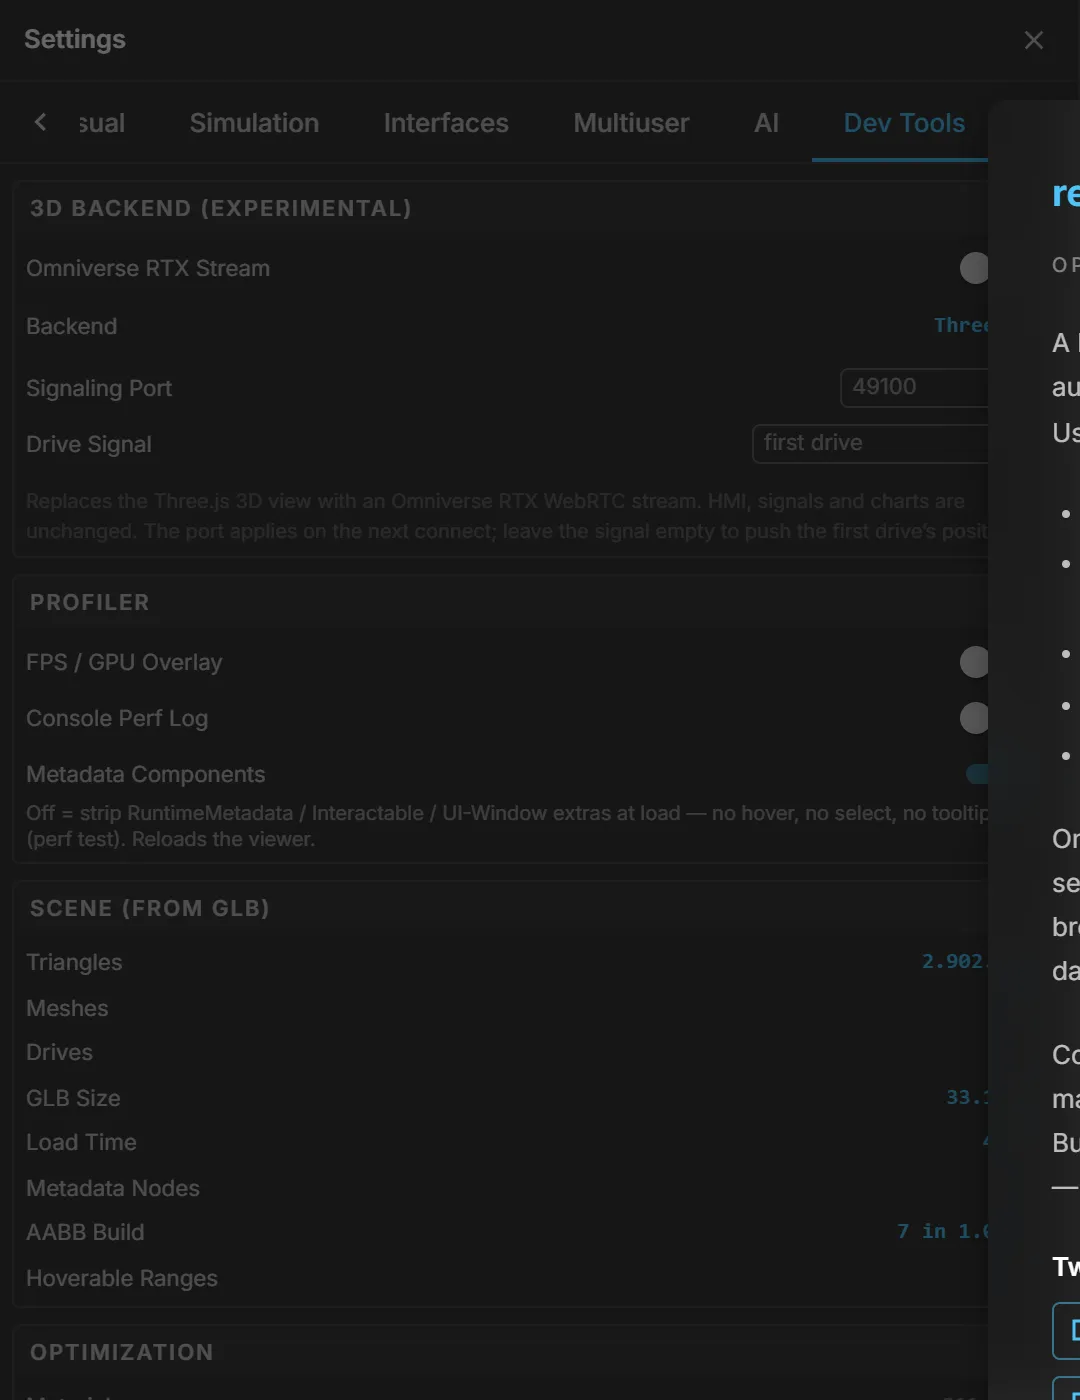
Use these diagnostics to investigate slow model performance:
- Scene (from GLB) — triangles, meshes, drives, GLB size and load time, straight from the loaded file.
- Optimization and Bake — what the loader did with it: materials merged, geometries shared, and the model prepared for drawing in fewer, larger parts.
- Load diagnostics and Asset cache — how long loading took, and which library parts came from the browser’s cache.
- Rendering — frame rate, frame time, draw calls, textures, JS heap, and which renderer is active.
- Picking & Highlight — how long a click takes to resolve, split by acceleration structure.
- Performance budget — each of those against a target, in percent. The bar that is at 100 % is the one to fix.
- GPU — which graphics card is drawing the scene, which others the browser exposes, and a warning when it has picked the wrong one. See Browser & GPU setup.
- GPU benchmark, profiler overlay and library cache provide further tools. Clear the library cache after replacing a
.glbon disk with a file of the same name.
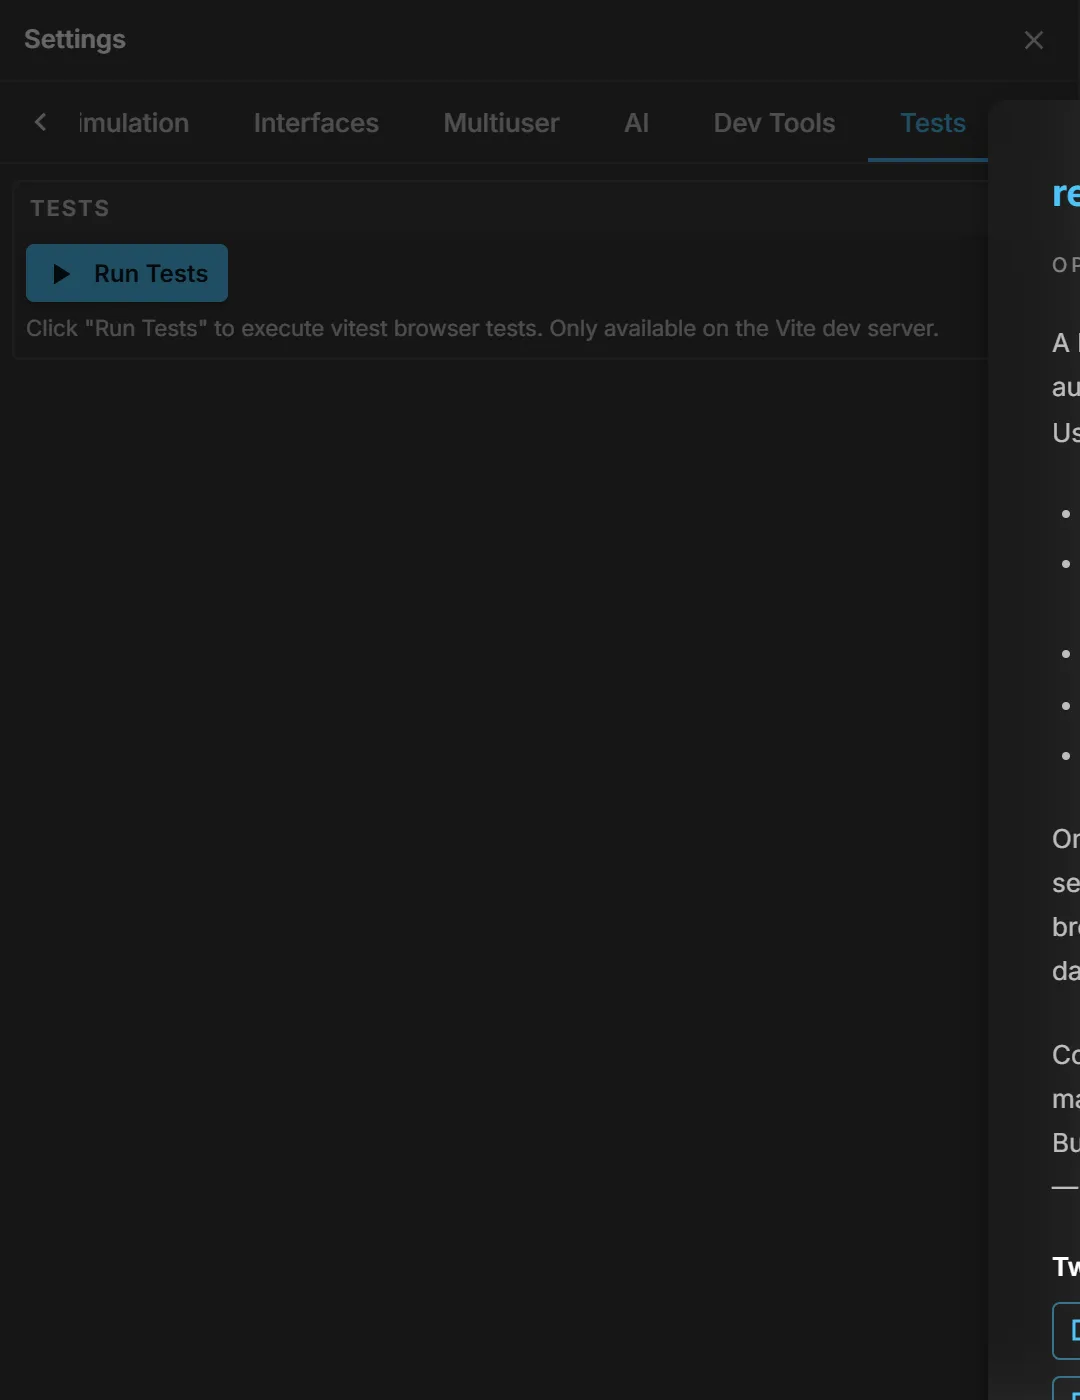
For realvirtual developers: runs the automated tests in the browser. In a delivered viewer the tab only says that it is not available.
Backup
Section titled “Backup”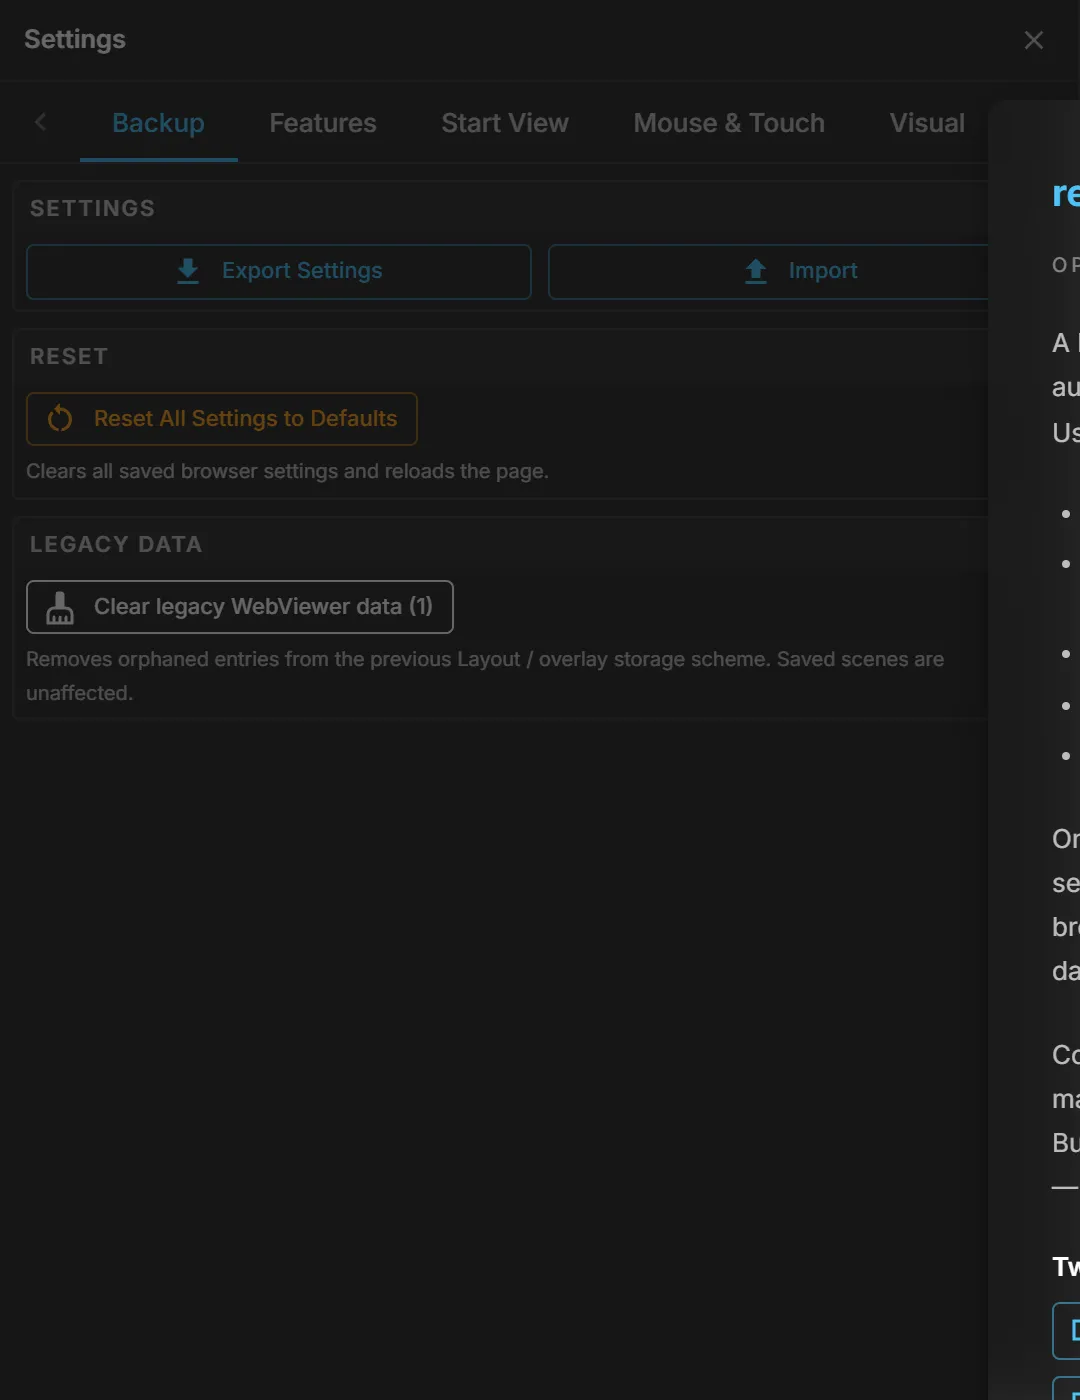
Click Export settings to save everything on this page to a file. Use Import to restore it or apply the same setup to another machine.
Reset All Settings to Defaults clears the saved browser settings and reloads.
Imported CAD Data ▸ Clear CAD import cache frees the space that converted STEP and other CAD files take up in the browser. Parts are converted again on their next import; layouts are not affected.
Clear legacy WebViewer data appears only when leftovers from an older storage scheme exist, and removes them. Saved documents are not affected.
Privacy ▸ Withdraw analytics consent appears where usage analytics are configured and you agreed to them. It stops them and reloads the page.
Use Old Working Folder to access a working folder from an earlier version. Click Copy into this project to copy the entire folder, including libraries, thumbnails and knowledge files, into the open project.
You can repeat the copy: it skips files already copied, and nothing in the old folder is changed or deleted. You decide when to delete the old folder.
This section appears only in browsers that can read local folders. It has no time limit, so you can copy an old folder months later.
Features
Section titled “Features”A commercial delivery adds a Features tab in every workspace except Viewer. It lists the add-on functions of the delivery — physics, machining, the IK solver and others — each with a switch.
Switching a function off disables its rendering and calculations as well as its button. Turn off unused functions to improve performance on a less powerful machine. The choice is stored per project. Functions required by the viewer cannot be switched off.
See also
Section titled “See also”- The interface — where these settings sit on screen
- Navigation and controls — what Mouse & Touch changes
- Documents — what a document brings with it