
The Interface
The 3D model fills the screen, with controls around the edges. Panels open on the left, with a narrow tool strip beside them. Machine messages appear on the right. View controls sit in the bottom corner.
Which elements you see depends on the delivery. A twin handed to an operator can be reduced to the 3D view and its messages; an engineering setup shows everything on this page. The twin can run without these interface elements.
The left bar
Section titled “The left bar”
The vertical bar on the far left opens the docked panels. One panel per side is open at a time; opening another replaces it.
| Button | What it opens |
|---|---|
| Projects | The documents you can open — the ones you saved yourself and the built-in examples — plus any attached libraries |
| Hierarchy | The structure of the twin as a tree |
| Annotations | Notes pinned to positions in the model |
| CONNECT | The gateway connection: interfaces, live signals, bridges |
| Multiuser | Shared sessions, when the delivery has them |
| AI Bridge | The connection to an AI assistant — see AI Assistant (Bridge) |
| Settings | Everything under Settings |
| Help | This documentation, opened in a new tab at the page that matches what you are doing — the window you have open, otherwise the workspace you are in |
The logo at the top of the bar shows version, build and licence of this viewer. The help button sits at the bottom of the bar, and F1 does the same thing. F1 works when the bar is hidden, for example in first-person view. It does not open help while you type in a field or in a kiosk delivery with help disabled.
Hierarchy
Section titled “Hierarchy”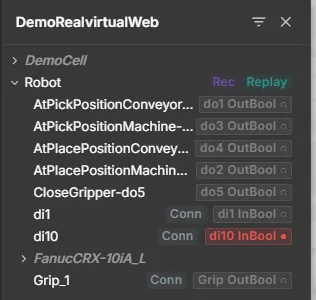
Use the hierarchy to select parts that are hidden or too small to click in 3D. Selecting a node selects its geometry. Selecting geometry highlights its node in the tree.
Moving through the tree
Section titled “Moving through the tree”- Expand and collapse with the arrow in front of a node. A node without an arrow is a leaf: geometry with nothing below it.
- Click a node to select it. The geometry highlights in the 3D view, and the component information opens for it.
- Click a part in the 3D view to scroll the tree to it and expand its parent nodes.
- The name is what the model brought with it. A prepared twin has descriptive names. Raw CAD imports retain the names from the CAD system. Change them in the Editor.
- The top row is the file itself. The first row is the model’s root. Select it to read its components and metadata. It has no eye toggle, drag handle or extra lock badge. Its name starts every path below it, and its position defines the file’s origin. In the Editor, the root’s transform is always read-only. Nodes below it remain editable.
Nodes in italics are groups rather than geometry — the structure the model was built with. The counter at the bottom of the panel gives the total node count — a quick check after an import.
Signals in the tree
Section titled “Signals in the tree”Each component shows its signals beside it, with their direction and current value. A red chip is an input written by the twin, a green one an output written by the controller — the same colours as everywhere else in the viewer. Signals connected to the gateway have a connection marker, making unbound signals easier to identify.
Components that can record and replay their motion carry Rec and Replay next to the name.
Notes on a node
Section titled “Notes on a node”A node can carry a note — a piece of written knowledge that travels inside the document: what this assembly is for, how it is commissioned, which torque a bolt takes. The component information displays the note as formatted text. Its header shows the date, author and confidence level. Long notes appear in a separate scrolling box that grows with the window.
Notes are shown read-only. An AI assistant writes them through the AI bridge, or they arrive with a model exported from Unity.
Filtering
Section titled “Filtering”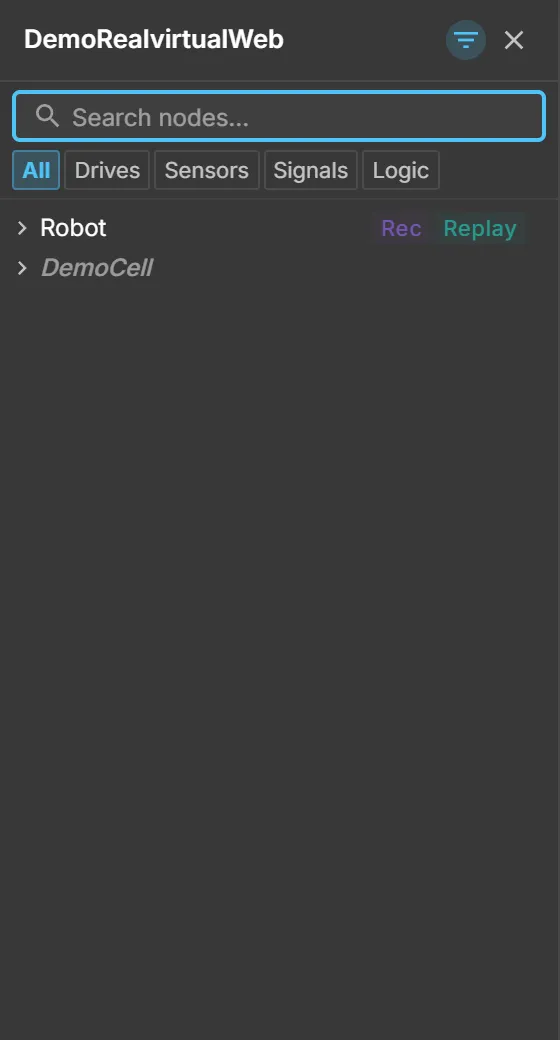
Use the filter in the panel header to show one component family: drives, sensors, signals or logic. The filter stays active until you reset it. The header indicates when filtering is on.
The tool strip
Section titled “The tool strip”
The narrow strip beside the panels holds the tools of the active workspace. In an HMI delivery that is typically:
| Tool | What it does |
|---|---|
| Machine, Drives, Sensors | Filtered views of what the machine contains |
| Alarms | Current faults, with a badge counting them |
| Maintenance | Due and overdue maintenance |
| AAS Components | Parts that carry Asset Administration Shell data |
| Order Cart | Spare parts collected for an order |
| Measure distance | Distance between two points in the model |
| Historian | Recorded signals as curves over time — see data recording |
| Section / Clip | A cut plane through the model to look inside |
View controls
Section titled “View controls”
The bottom right corner controls what you see, without changing the model:
- Camera presets 1, 2, 3 — stored viewpoints for a repeatable inspection position. A short click jumps there, holding the button saves the current view onto it.
- Visibility and layer switches — hide groups of geometry, for example a fence or a housing.
- VR and first-person — enter the scene with a headset or walk through it, where the delivery supports it.
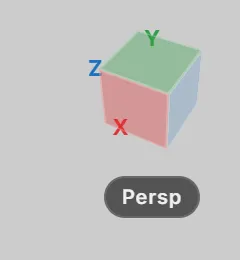
The cube in the top right corner shows the current orientation; clicking one of its faces snaps the camera to that axis. Below it, the projection switches between perspective and orthographic.
Along the top edge sit the workspace mode selector and, in an HMI delivery, the key figures. The H key hides the whole overlay and leaves only the 3D model — useful for a screenshot or a wall display.
Workspace modes
Section titled “Workspace modes”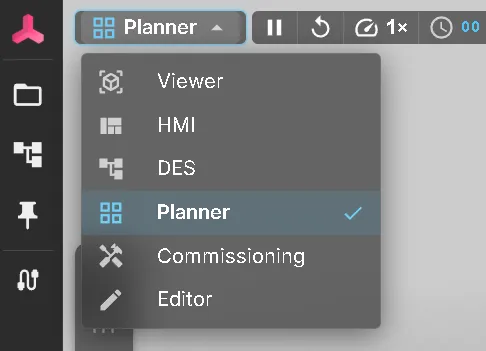
The workspace mode selects the panels, tools and gizmos available for working with a document. Switching modes leaves the document unchanged.
| Mode | What it is for |
|---|---|
| Viewer | The spectator workspace: the model and its running kinematics, the view controls and the settings. Nothing to author, no panels, no signals |
| HMI | The operator surface — key figures, machine messages, alarms, live signals. The default where a delivery says nothing else |
| DES | Discrete event simulation: throughput, material flow, experiments |
| Planner | The Layout Planner: placing library objects and connecting them into a line |
| Commissioning | The same lean surface as the Viewer, without the operator HMI, but with what an integrator needs to put a machine into operation: inspector, hierarchy, CONNECT and the AI bridge |
| Editor | The Editor: authoring an asset — structure, kinematics, materials and signals. The simulation does not run here |
Which of them appear depends on the delivery. The Editor is a commercial feature and is absent from an open-source deployment; an operator delivery is usually locked to a single mode so the selector does not appear at all.
Opening a link in a mode
Section titled “Opening a link in a mode”A link can name the mode it should open in:
https://<your-deploy>/?doc=<id>&mode=commissioningValid values are the mode ids: viewer, hmi, des, planner, commissioning and editor. If a mode is unavailable in this delivery, the viewer ignores it without an error. It uses the document’s mode, then the last session’s mode, or HMI if neither is set.
Use ?doc=new&mode=editor to create a new asset in the open project. It opens in the Editor with the CAD import dialog.
https://<your-deploy>/?doc=new&mode=editorThe full set of link parameters is under sharing models.
Kiosk deliveries
Section titled “Kiosk deliveries”A delivery can lock the workspace so the mode selector disappears entirely and the twin always opens in the one surface it was delivered for — a panel PC at the machine, a wall display, a booth. This is set once in the delivery configuration, not by the person at the screen. See appliance deployment.
Settings
Section titled “Settings”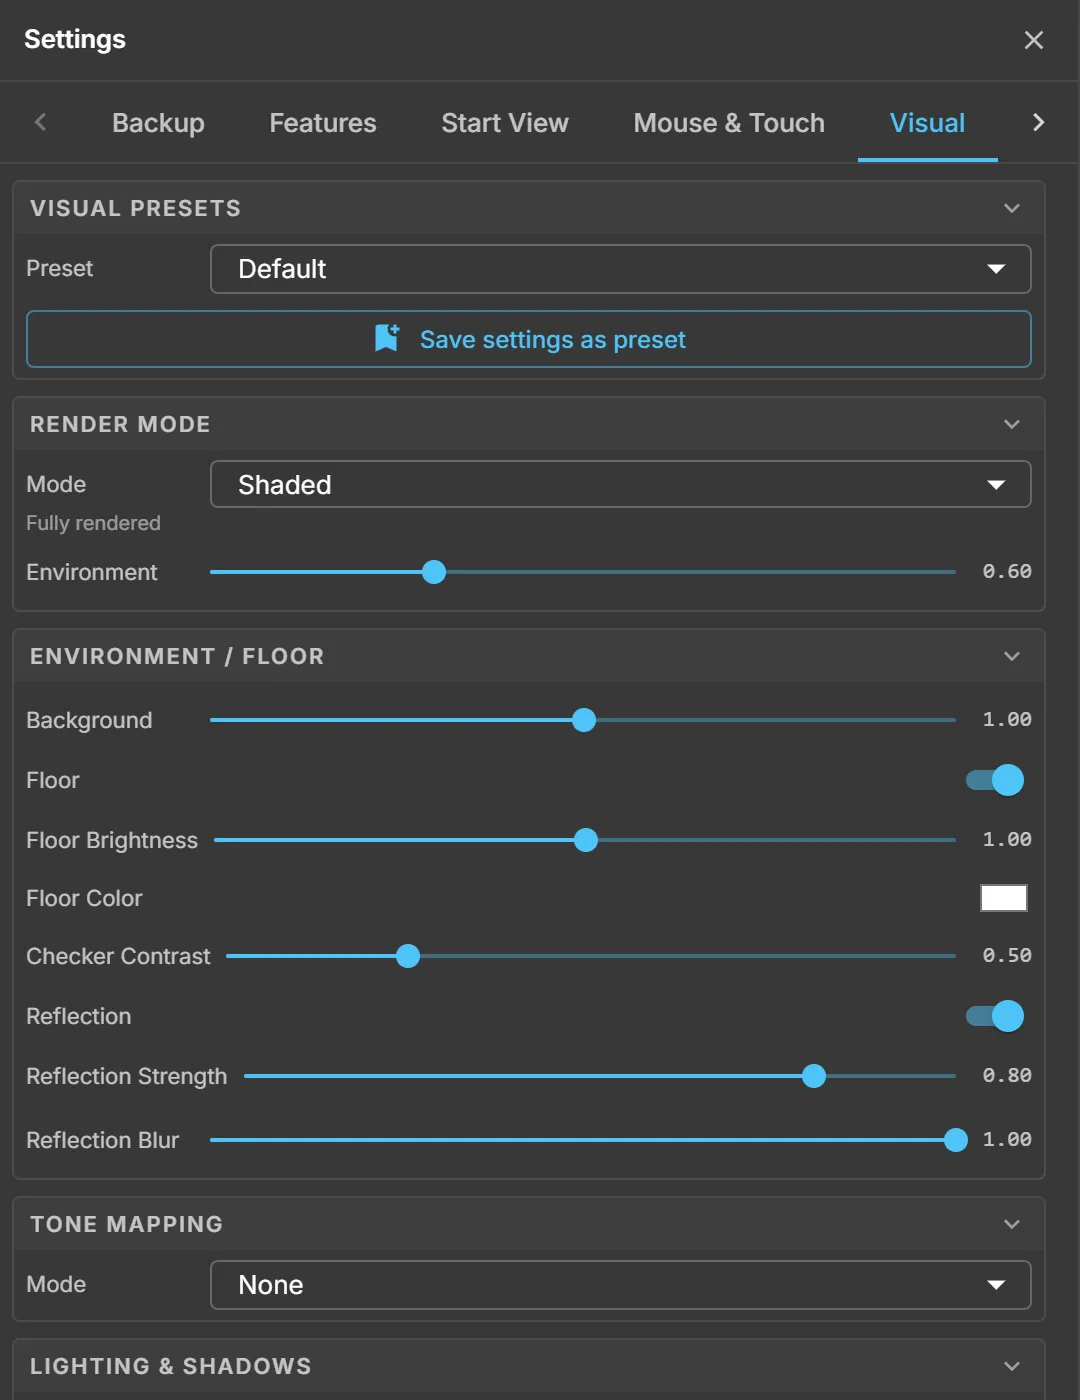
The gear at the bottom of the left bar opens the settings. They are stored in the browser, not in the model. A delivery can lock individual tabs so an operator cannot change them. See Settings for each tab. Include the viewer version and build number from the bottom of the panel in support requests.
Quick Start
Section titled “Quick Start”- Open Hierarchy and expand the twin until you find a component.
- Select it and confirm the geometry highlights in the 3D view.
- Read its signals beside the tree entry.
- Open Settings ▸ Visual and lower the quality if the model runs sluggishly.
- Press H to hide the overlay, and again to bring it back.
See also
Section titled “See also”- Navigation and controls — mouse, touch and keyboard
- Documents — what a document brings with it
- Machine information system — what a selected part can tell you
- Signals and alarms — the live values behind the tree