Discrete event simulation
Simulate material flow much faster than real time and assess throughput, utilisation and bottlenecks. Use the results to support decisions about AGV numbers, buffers and shifts before building or changing the system.
Try this use case in the free Public Demo, without an account or installation. Public Demo limits →
Support capacity decisions with simulation results
When planning material flow, you need to determine how many AGVs are required, where buffers are needed and which station limits throughput. These decisions also arise when changing an existing system during operation.
Run the layout on event time and examine how stations spend their time working, transporting or blocked. Compare variants with repeated runs to support the choice of AGV numbers, buffers and shifts.
Evaluate utilization and throughput
See which components are working, idle or blocked and how much material they handle. The statistics are linked to the 3D model, so you can find the component behind every figure.
Compare component utilization
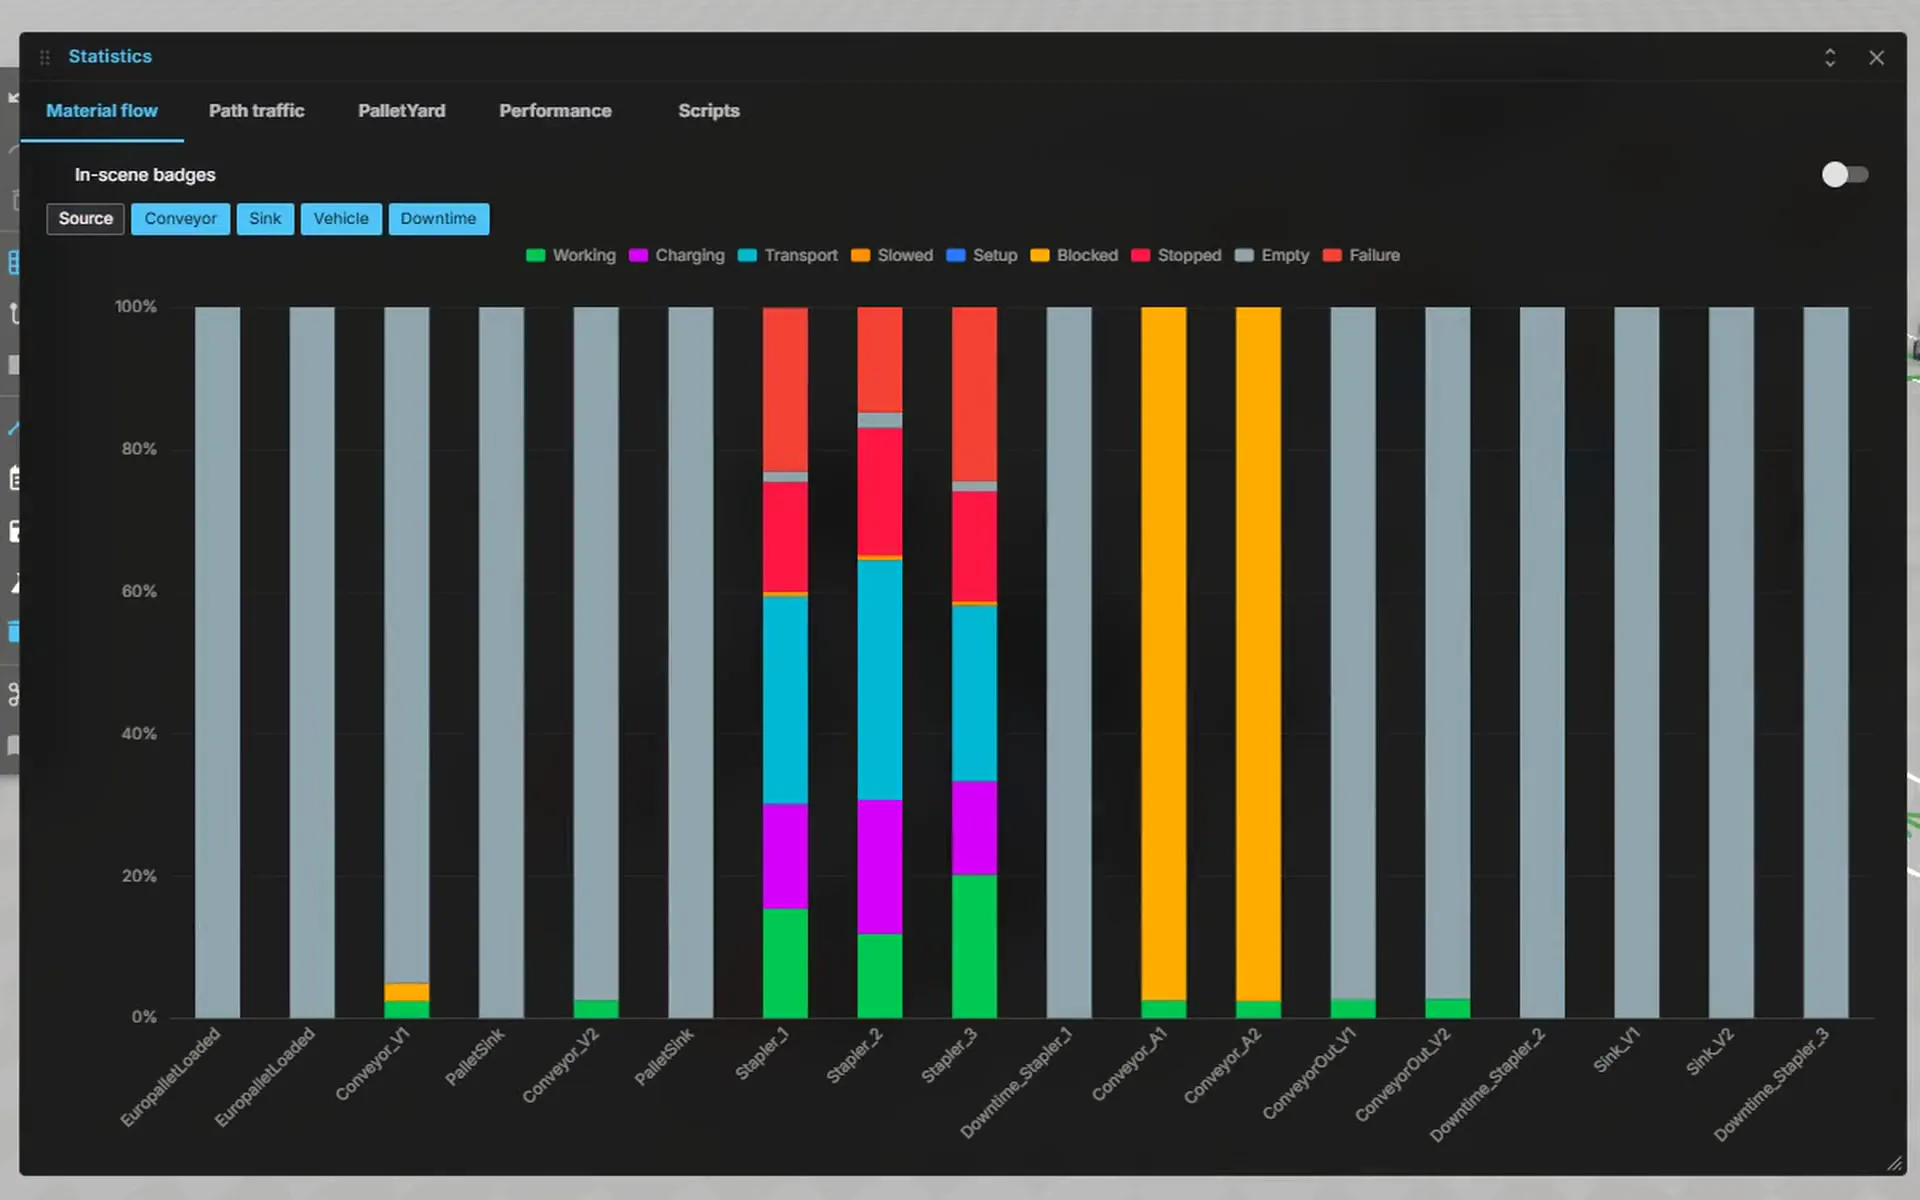
The “Material flow” statistics window shows one stacked utilization bar per component, ordered by material flow and filterable by component type. States include Working, Transport, Setup, Blocked, Empty and Fault, with Charging, Braked and Stopped added for vehicles.
Inspect individual component figures
Hover over a bar to highlight its object in 3D. Each component’s tooltip shows its state, occupancy and capacity, utilization, share of time in each state, throughput per hour and total quantity.
Show statistics in 3D
Enable statistics badges in the toolbar to display a state bar and throughput per hour above each station. Custom values from scripts also appear in the statistics.
Control simulation runs
Run at 1×, 5×, 10× or 50× speed, or use fast mode without animation and follow its progress bar. Step through individual events and configure the simulation end and statistics reset.
Compare variants with the Experiment Manager
Compare parameter variants across repeated runs and assess the uncertainty in their results. The Experiment Manager is part of Commercial and can be tried in the Public Demo.
Define a variant matrix
The first column contains the baseline configuration as your reference; further columns define variants. Each variant overrides component parameters such as vehicle count, MTBF or MTTR.
Configure repeated simulation runs
Set 1–999 runs per column, the run duration and a warm-up period after which statistics begin. Random numbers are generated automatically for each run; using the same random numbers across variants is enabled by default for fair comparisons.
Choose your performance metrics
Throughput per hour and average utilization are built in; add up to 32 custom metrics from component values, script values or metrics aggregated as mean, sum, minimum or maximum. Specify whether higher or lower values are better for each metric.
Compare results and uncertainty
Each result cell shows the mean ± a 95% confidence interval and the difference from the baseline with its interval. View a bar chart with confidence intervals or a time series showing individual runs.
Keep experiment results traceable
Results are saved with the project and marked as outdated when the setup changes. Your AI agent can also start experiments through the MCP server.
From layout to a comparison of variants
Build or reuse a layout
Assemble a layout from library components or continue with an existing layout. Use the same model as the basis for the material flow study.
Layout planning →Run on event time
Choose discrete event simulation to advance from event to event. Simulate operation much faster than real time to investigate material flow over longer periods.
Discrete event simulation →Read station statistics
Read utilisation and throughput from the statistics and identify bottlenecks. Badges at the stations and the statistics window show states such as working, transport and blocked.
Statistics and bottlenecks →Compare variants in the experiment manager
Define variants, run repeated simulations and compare means with confidence intervals. The experiment manager for these studies is part of Commercial.
Experiment manager →Share results through a link
Share the project and its results through a link. Make the study accessible in the browser for discussion with planning, operations and customers.
Presentation and sharing →
Demo models to try
Open the models in the Public Demo, without an account or installation.
Pallet Yard
Three AGV forklifts on a one-way route network serve two production outputs, six storage locations, two shipping lanes and two charging stations; change the yard size and cycle time in the planning window. Experiments compare the baseline of three AGVs with failures against two AGVs, four AGVs and operation without failures, each over five eight-hour runs: in this model, failures reduce throughput by around a fifth, while a fourth AGV brings no improvement because the vehicles block one another.
Open in the demo ↗ (opens in a new tab)Layout planner demo
Explore a pallet loop assembled from library conveyors, transfer units and turntables. Try connecting the components at snap points.
Open in the demo ↗ (opens in a new tab)
Frequently asked questions
What is the difference between discrete event and time-stepped simulation?
Discrete event simulation advances from one event to the next, such as an arrival, a completed operation or a machine failure. Time-stepped simulation calculates the sequence at fixed time steps. Event time lets you examine material flow much faster than real time.
How many runs do I need for reliable results?
The five runs per variant shown in the clip illustrate the workflow and are not a general requirement. The experiment manager compares means with 95% confidence intervals. Assess the variation and interval widths against the planning decision, and increase the number of runs if needed.
Is the experiment manager free?
Discrete event simulation with statistics is part of Community. The experiment manager with variants, repeated runs and run comparison is part of Commercial. You can try both in the free Public Demo without an account or installation.
Which statistics can I inspect at a station?
Station badges and the statistics window show utilisation, throughput and states such as working, transport and blocked. Use them to investigate where material flow stalls and which stations limit throughput.
Can I use an existing layout and share the results?
Yes, you can use an existing layout as the basis for discrete event simulation. Share the project and its results through a link so others can access them in the browser.
Explore material flow in PalletYard
Open the Public Demo to inspect station statistics and compare variants in the experiment manager. Discuss your project if you want to investigate AGV numbers, buffers or capacity changes.